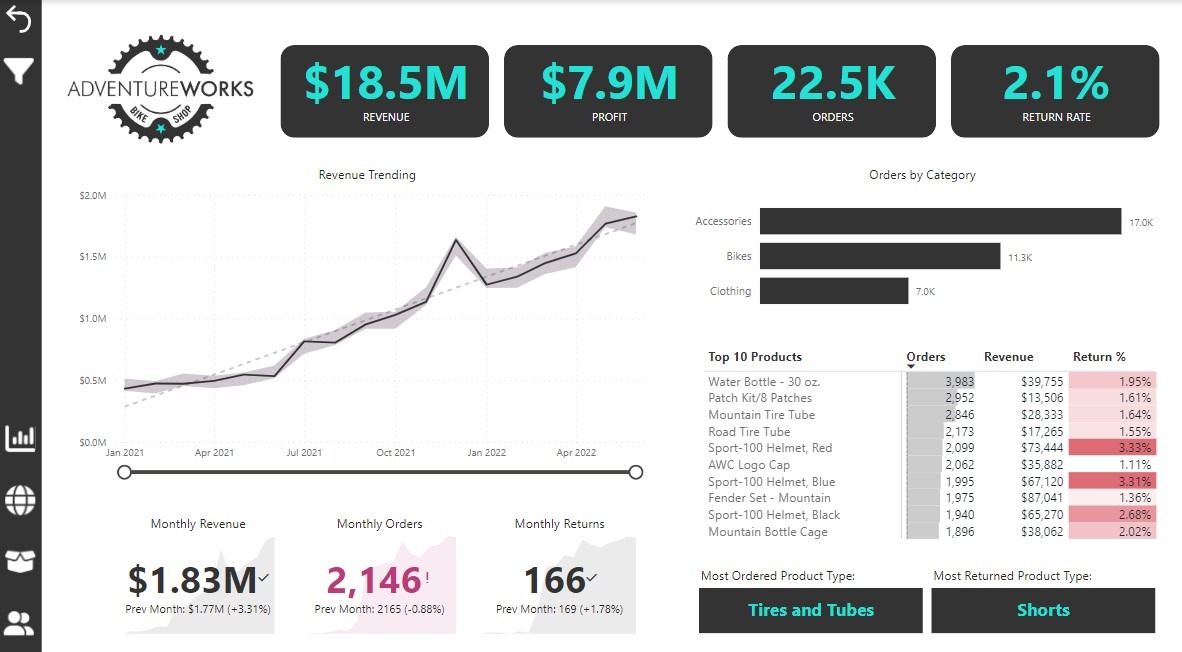
Developed a dynamic sales dashboard with Power BI based sales visualization of Adventure Works Sale data to indicate profit by product, sales, and other significant factors that might influence the company’s performance using DAX commands. The Goal was to track the Key performance indicator (KPI) Compare regional performance Analyse product level Trends Identify high value customers
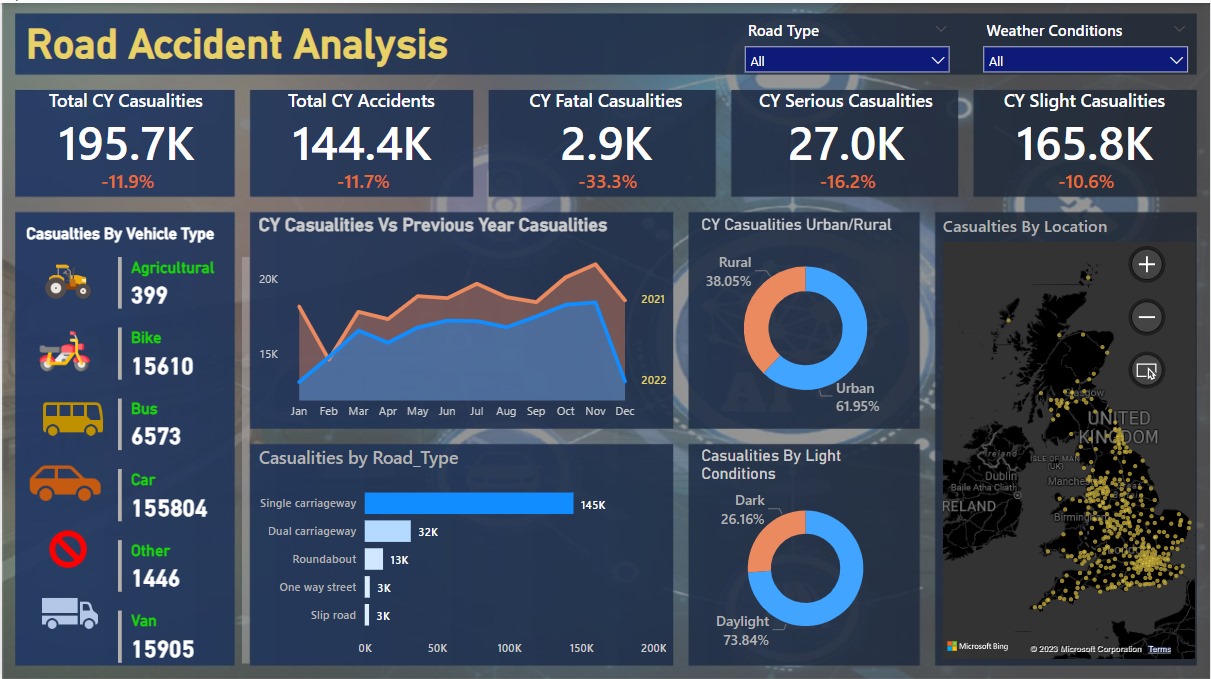
This Project aims to provide insightful and comprehensive analysis of road accidents using the powerful data visualization capabilities of Microsoft Power BI. This project utilizes real-world data related to road accidents, such as accident locations, causes, vehicle types, and associated factors, to extract valuable insights and support evidence-based decision-making in the field of road safety. The insights derived from the project can be used to implement targeted interventions, enhance road safety measures, and ultimately reduce the frequency and severity of road accidents, leading to safer transportation systems for communities.
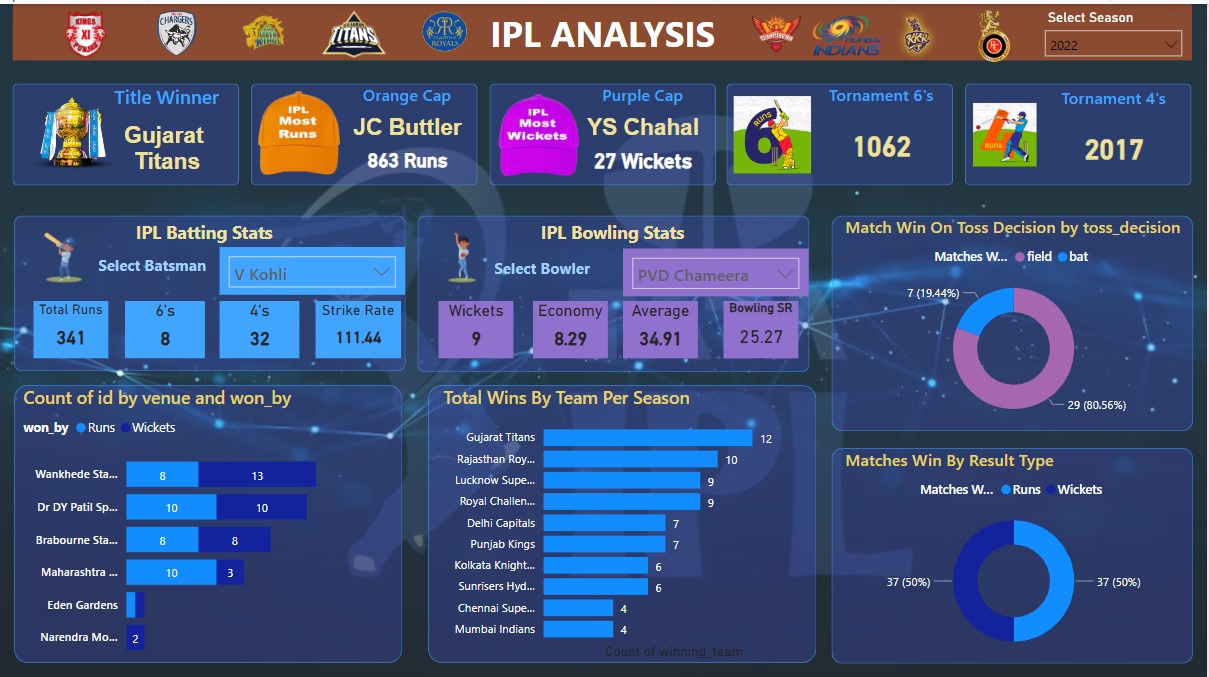
The IPL Analysis dashboard in Power BI is an interactive tool that uses data from various sources to present insights into the performance of teams, players, and matches in the IPL cricket tournament. The dashboard features visually appealing charts, graphs, and tables that help users explore and analyze different aspects of the tournament.
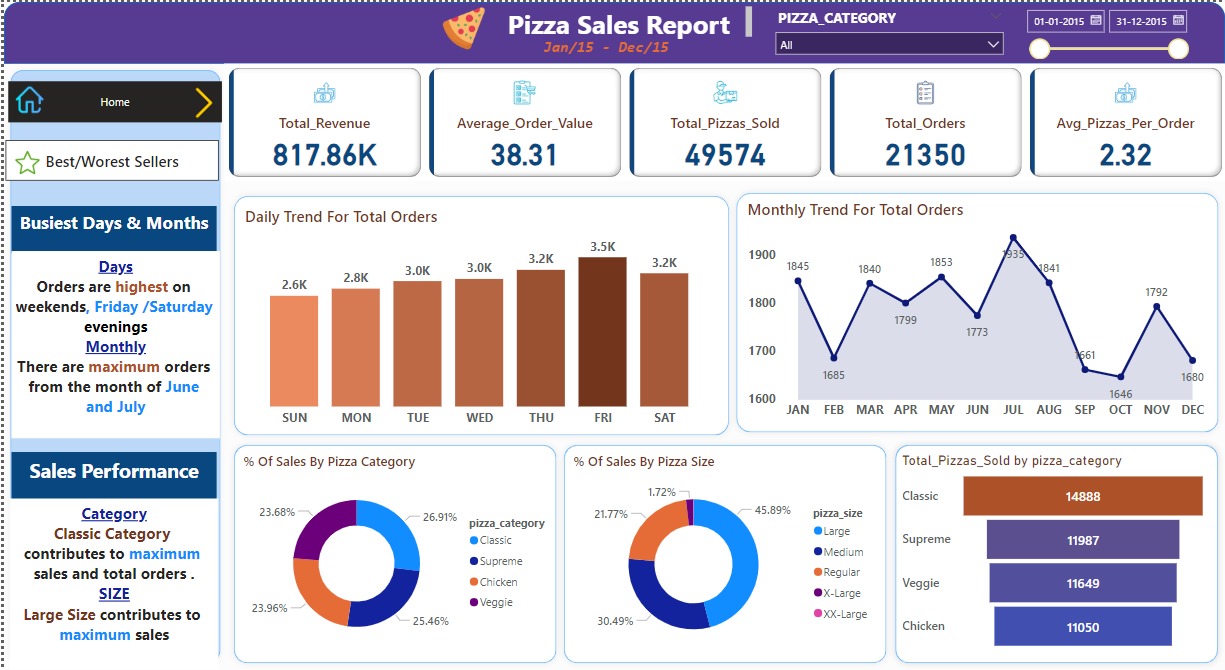
To analyze customer traffic trends and identify peak days and months in order to optimize staffing and improve operational efficiency, To identify the average number of pizzas in an order, as well as the top-selling pizzas, in order to inform inventory management and marketing strategies and to assess the popularity of various pizzas on the menu and identify any underperforming items or opportunities for promotion in order to optimize the menu and increase sales.
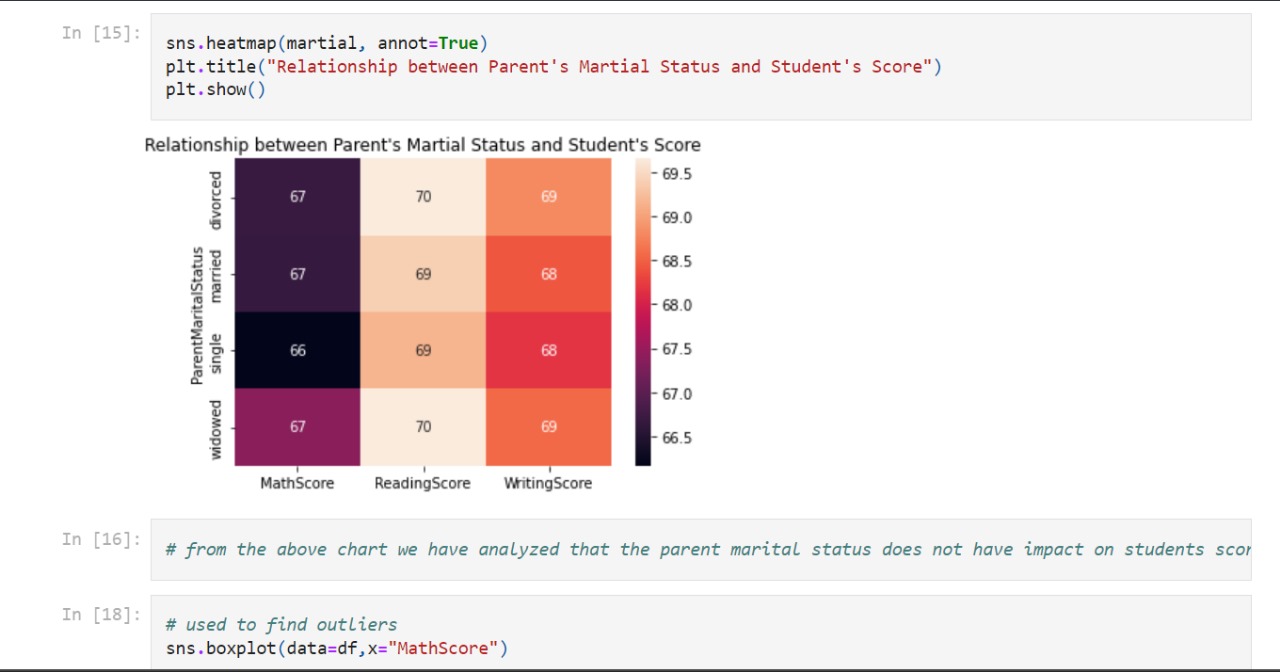
This is a Student Result Analysis Project which aims to predict student's marks using various Python Libraries like Numpy,Pandas,Matplotlib,Seaborn.The idea behind this analysis is to predict the marks of students by their studying hours, parents education , other factors that may affect the students marks.
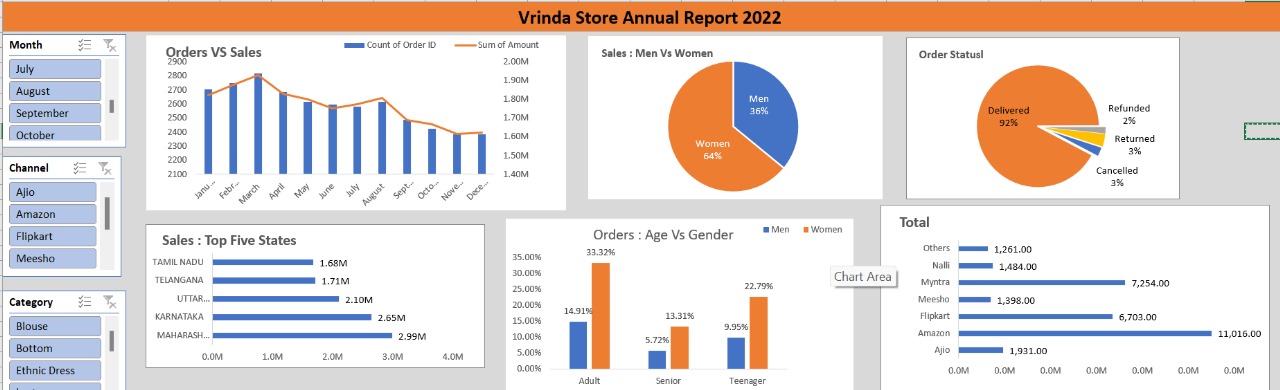
The project encompasses an in-depth analysis of Vrinda Store's sales data, aiming to uncover key patterns, trends, and factors influencing sales. The analysis primarily focuses on identifying the top contributing states, gender preferences, significant sales channels, and target age groups. These insights serve as a foundation for formulating effective strategies to enhance sales.
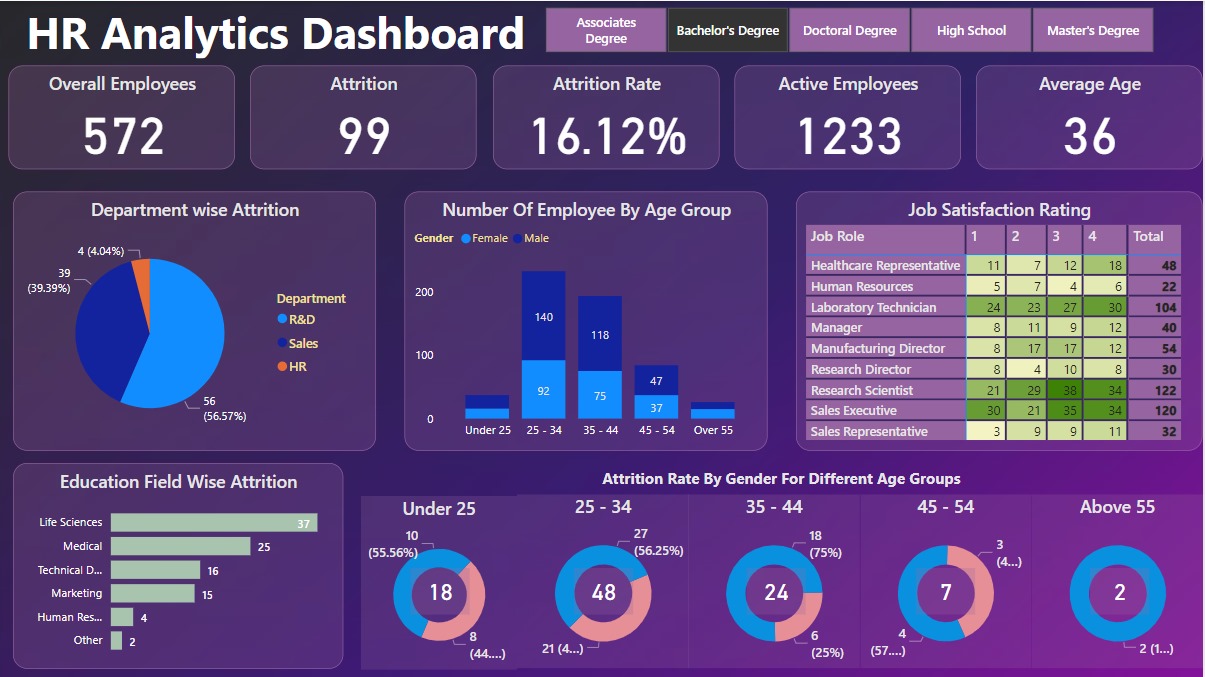
This dashboard allows HR professionals and managers to easily track and analyze data on employee performance, demographics, and compensation, as well as measure employee satisfaction and engagement levels. With interactive visualizations and drill-down capabilities, users can quickly identify patterns and trends in the data, enabling them to make data-driven decisions to improve the overall performance and productivity of the organization by reducing the attrition rate.